11 Signs That U.S. Consumers Are In Very Serious Trouble As We Head Into The Final Stretch Of 2023


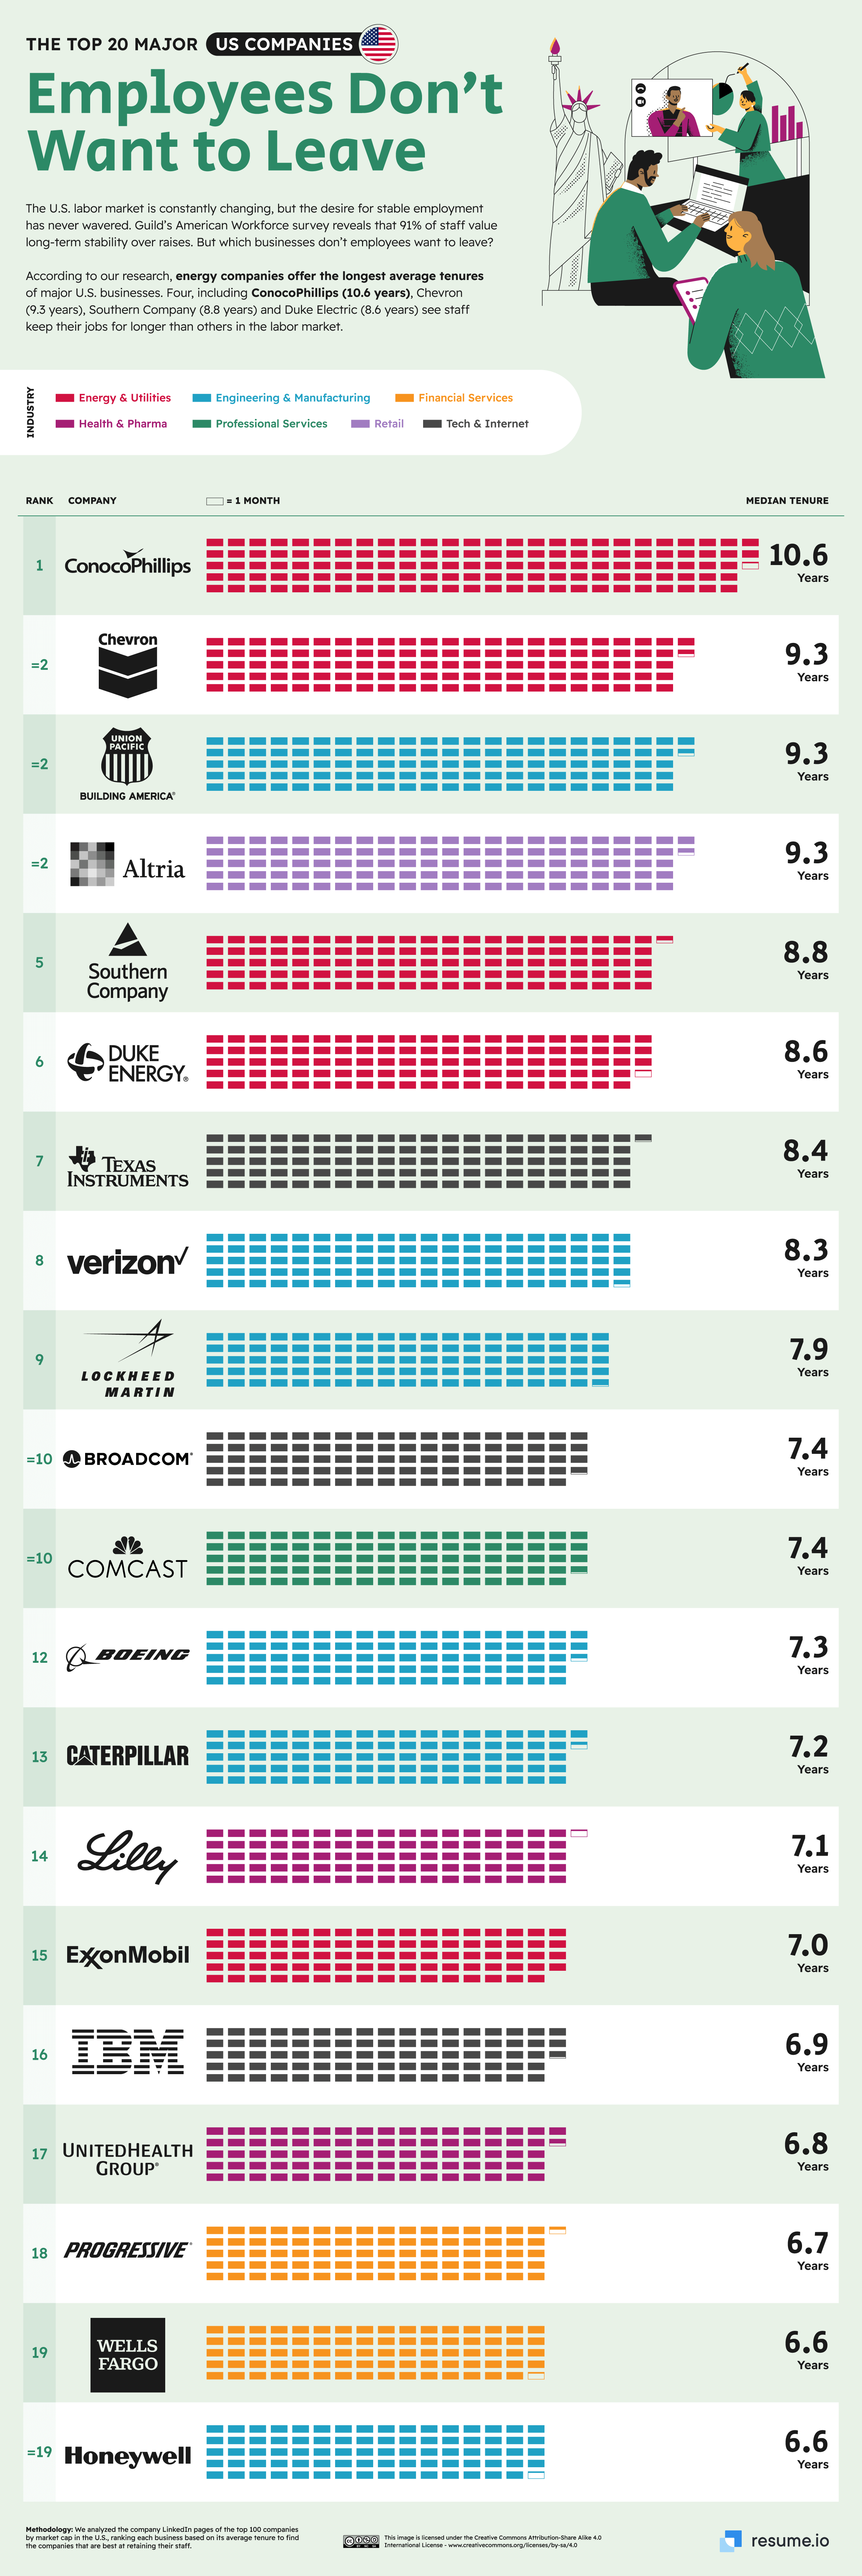
Top Companies for Employee Retention in the U.S. and UK
Workers weigh various factors when deciding to stay with a company for an extended period. These include a positive work environment, fair compensation, job security, opportunities for professional growth, and resilience against disruptive changes in the economy or technology.
So, which companies excel in employee retention?

Subscribe to the Elements free mailing list for more like this
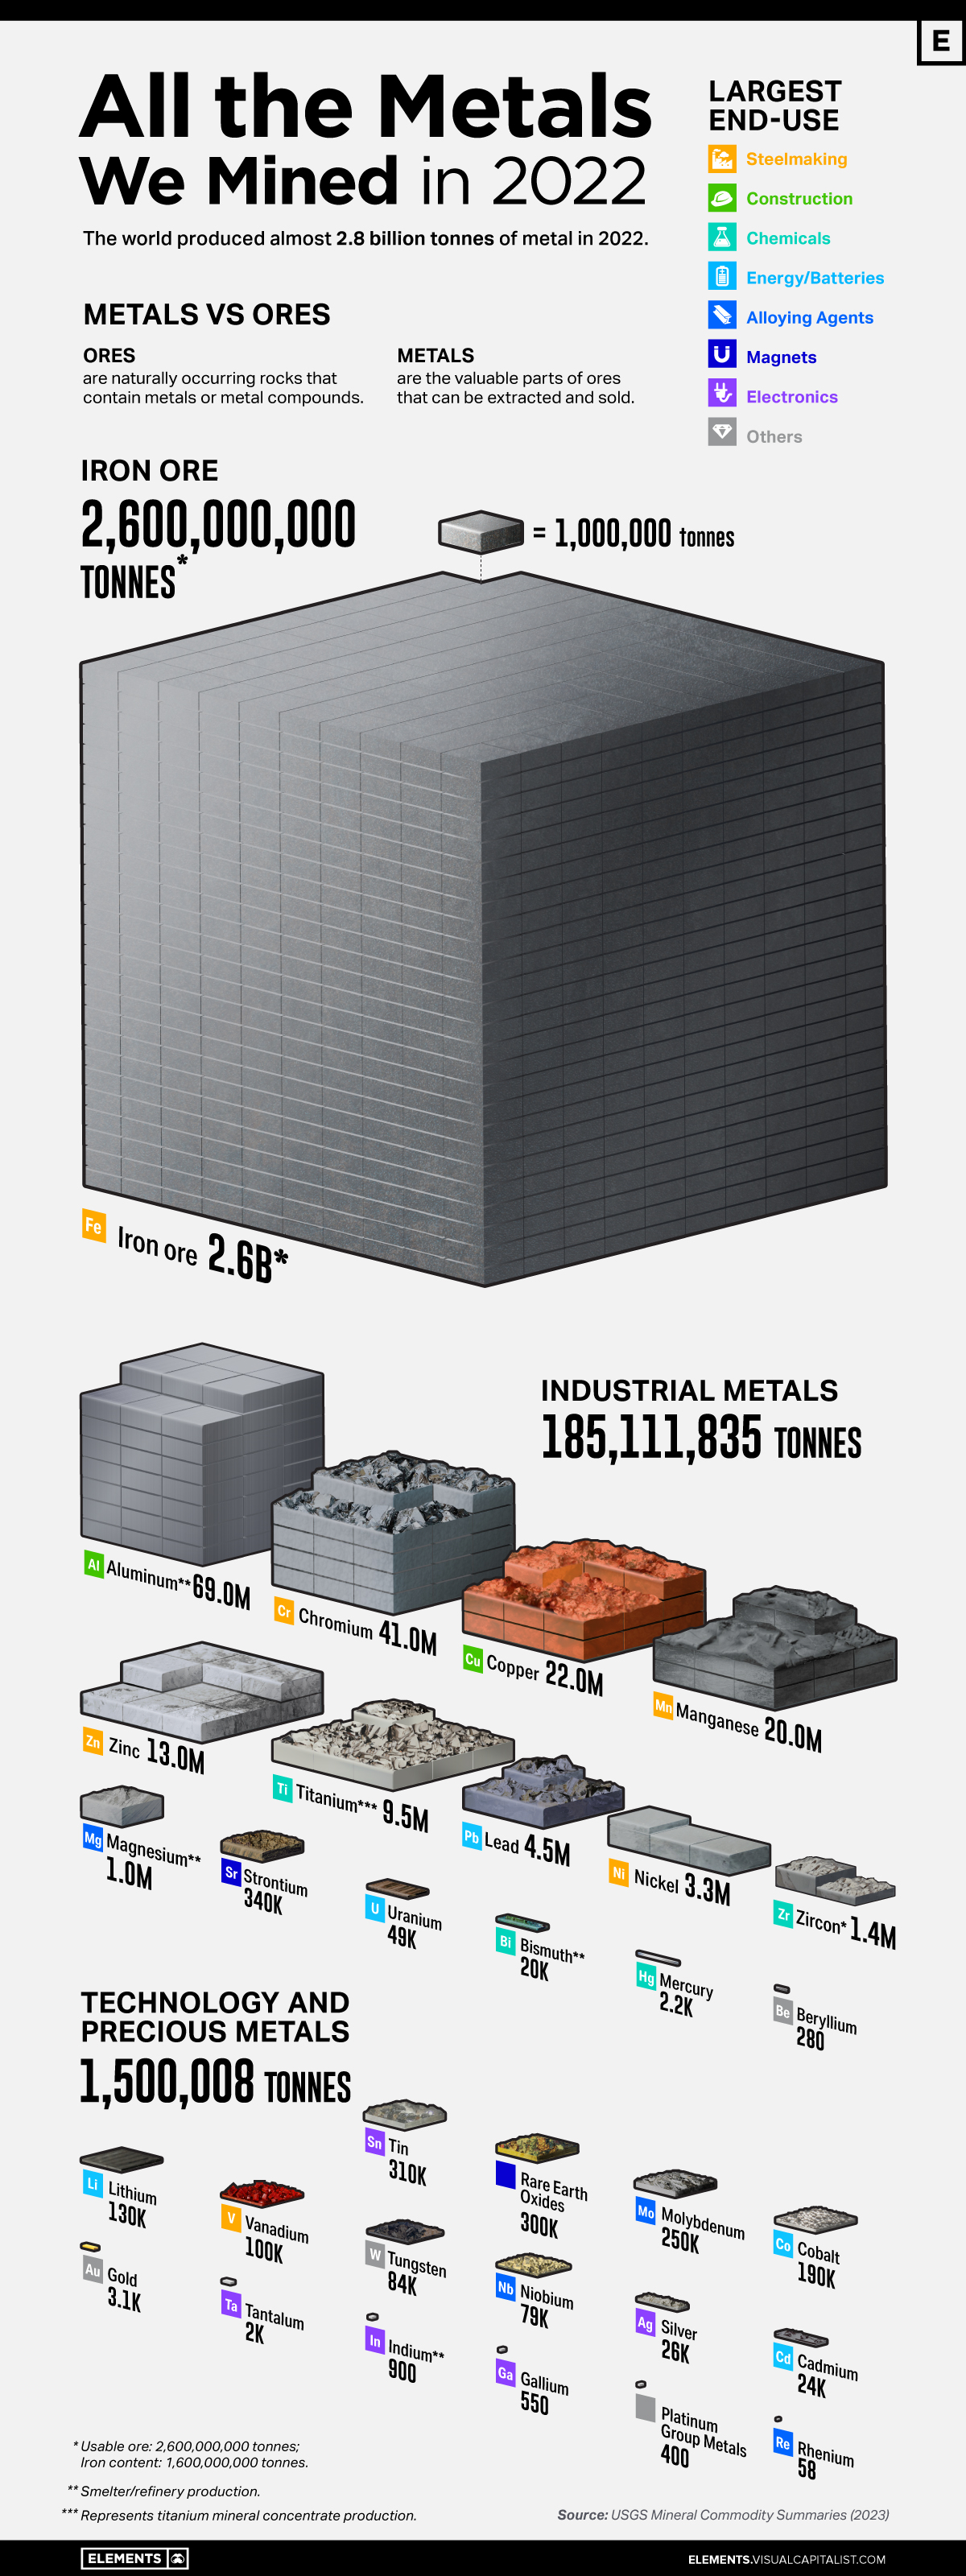
All the Metals We Mined in One Visualization
This was originally posted on Elements. Sign up to the free mailing list to get beautiful visualizations on natural resource megatrends in your email every week.
Metals are a big part of our daily lives, found in every building we enter and all devices we use.

Visualizing America’s $1 Trillion Credit Card Debt
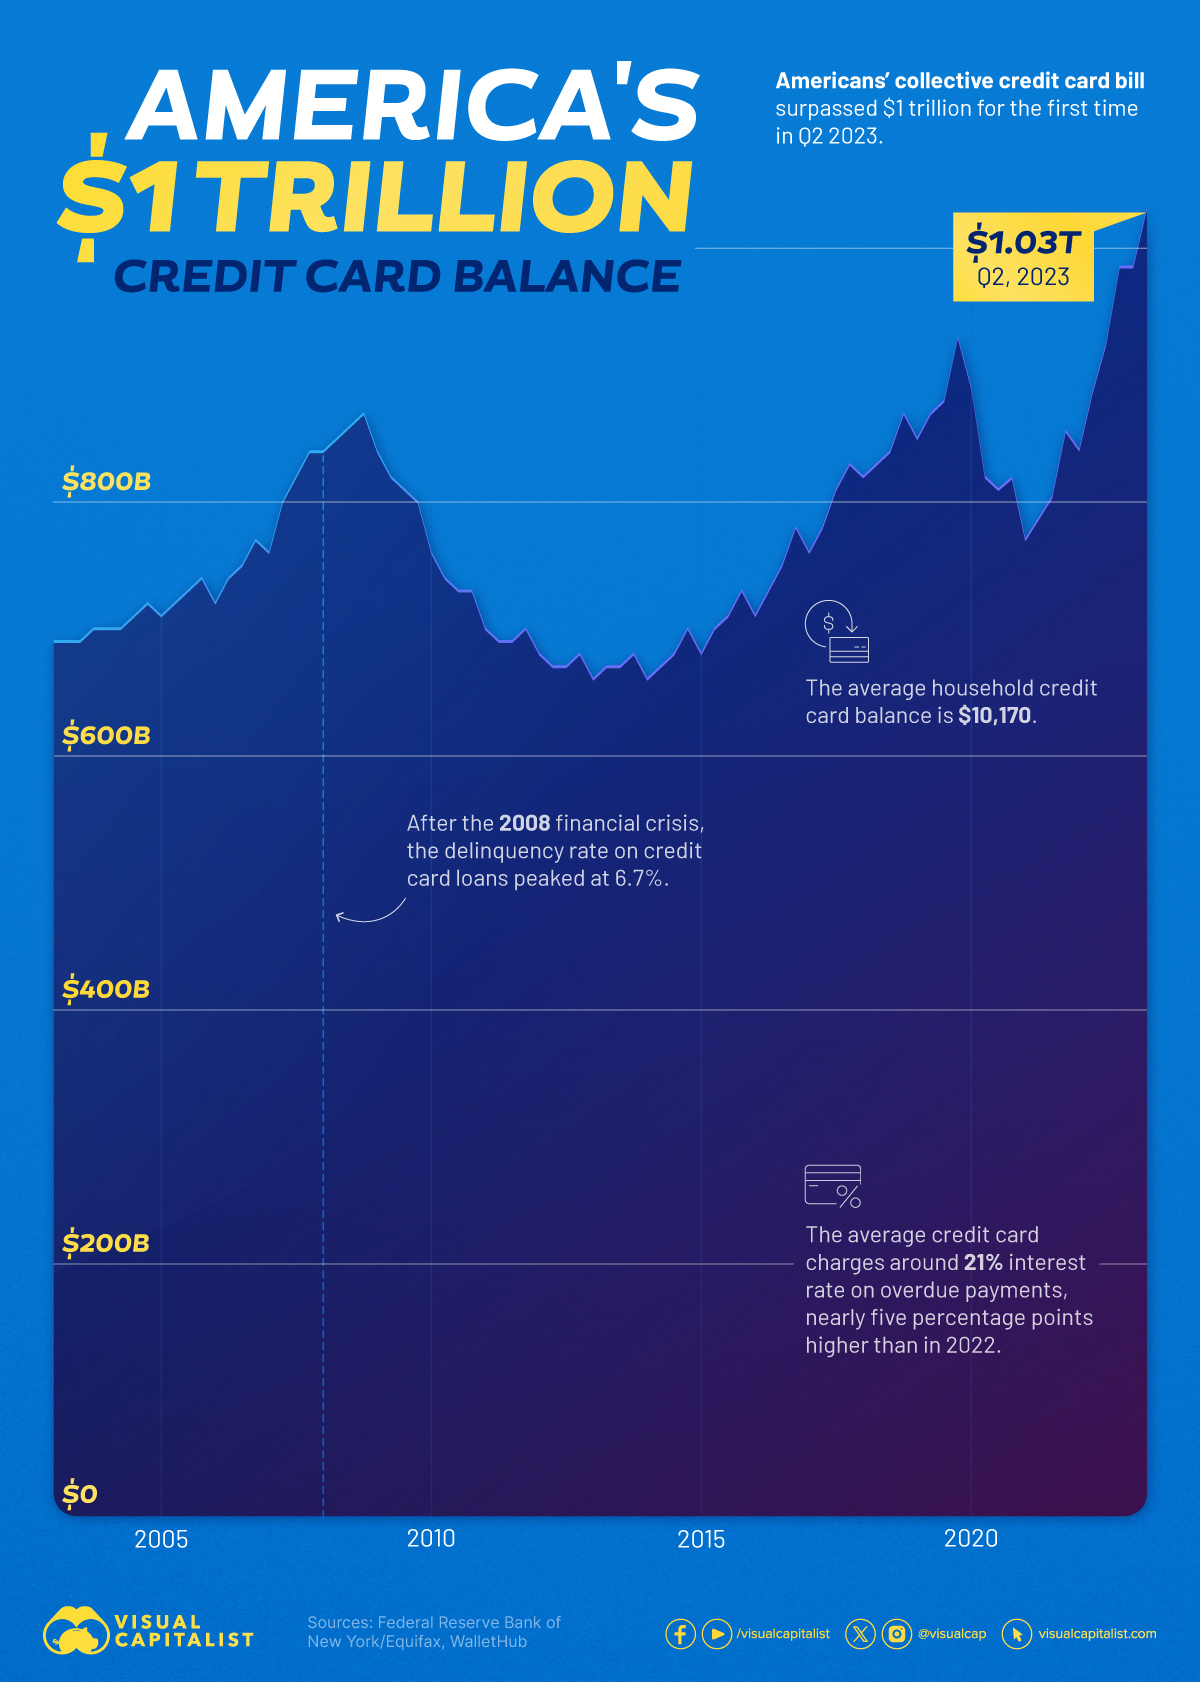
Americans’ collective credit card debt surpassed $1 trillion for the first time in Q2 2023.
Between April 1 and June 30, total credit card balances rose by $45 billion compared to Q1 2023, to $1.03 trillion.
This chart uses data from the Federal Reserve Bank of New York and WalletHub to illustrate the growing credit card debt in the United States.
Over $10,000 Balance per Household
