![]()
See this visualization first on the Voronoi app.
Use This Visualization
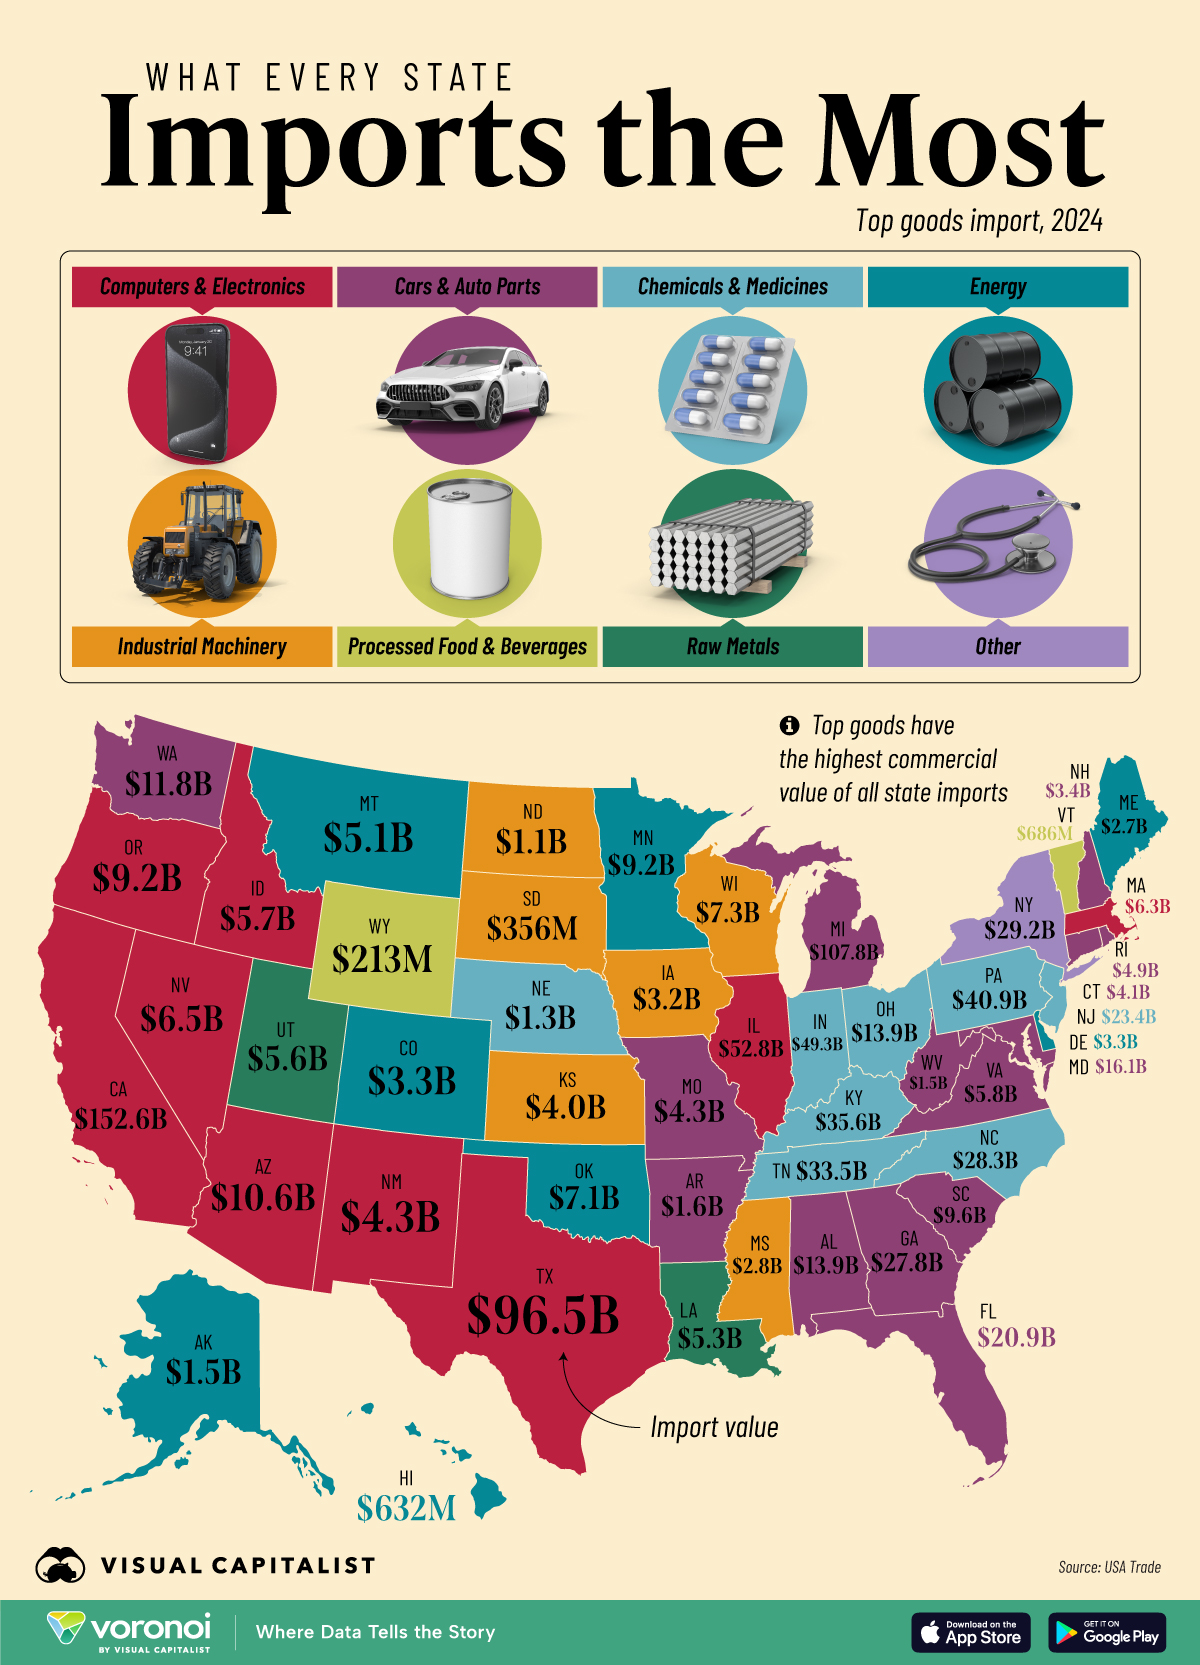
Mapped: The Top Import in Every U.S. State
This was originally posted on our Voronoi app. Download the app for free on iOS or Android and discover incredible data-driven charts from a variety of trusted sources.
Key Takeaways
- Cars and auto equipment are the highest value import in 14 states.
- Computers and electronics (including phones and chips) are the top import in another nine states.
- Together, these two categories—targets of on-again, off-again broad-based tariffs—are the top import in about half of all states.
Nothing is drawing more focus in the global economy than trade patterns and supply chains.
What is the U.S. importing, where is it coming from, and how are Trump Administration tariffs affecting or moving cross-border supply chains? There are all key questions in the news cycle.
To add context to this discussion, we mapped the top import for each U.S. state in 2024 with data from the Census Bureau.
Top good categories have the highest commercial value of each state’s imports.
However, each state imports a variety of things, particularly the more populous ones, and this map should be used more as a reference point for major import categories.
What Every U.S. State Imports the Most
Cars and auto equipment are the highest value import in 14 states. This category includes fully finished cars, as well as those half-assembled cars, auto parts, and airplane parts.
Noted automaker state Michigan—home of the Big Three—leads the country in the dollar value ($108 billion) of these imports.
| State | Code | Highest Value Import | Import Value ($) |
|---|---|---|---|
| Alabama | AL | Cars & Auto Parts |
$13.9B |
| Alaska | AK | Energy | $1.5B |
| Arizona | AZ | Computers & Electronics |
$10.6B |
| Arkansas | AR | Cars & Auto Parts |
$1.6B |
| California | CA | Computers & Electronics |
$152.6B |
| Colorado | CO | Energy | $3.3B |
| Connecticut | CT | Cars & Auto Parts |
$4.1B |
| Delaware | DE | Energy | $3.3B |
| Florida | FL | Cars & Auto Parts |
$20.9B |
| Georgia | GA | Cars & Auto Parts |
$27.8B |
| Hawaii | HI | Energy | $632M |
| Idaho | ID | Computers & Electronics |
$5.7B |
| Illinois | IL | Computers & Electronics |
$52.8B |
| Indiana | IN | Chemicals & Medicines |
$49.3B |
| Iowa | IA | Industrial Machinery |
$3.2B |
| Kansas | KS | Industrial Machinery |
$4.0B |
| Kentucky | KY | Chemicals & Medicines |
$35.6B |
| Louisiana | LA | Raw Metals | $5.3B |
| Maine | ME | Energy | $2.7B |
| Maryland | MD | Cars & Auto Parts |
$16.1B |
| Massachusetts | MA | Computers & Electronics |
$6.3B |
| Michigan | MI | Cars & Auto Parts |
$107.8B |
| Minnesota | MN | Energy | $9.2B |
| Mississippi | MS | Industrial Machinery |
$2.8B |
| Missouri | MO | Cars & Auto Parts |
$4.3B |
| Montana | MT | Energy | $5.1B |
| Nebraska | NE | Chemicals & Medicines |
$1.3B |
| Nevada | NV | Computers & Electronics |
$6.5B |
| New Hampshire | NH | Cars & Auto Parts |
$3.4B |
| New Jersey | NJ | Chemicals & Medicines |
$23.4B |
| New Mexico | NM | Computers & Electronics |
$4.3B |
| New York | NY | Other | $29.2B |
| North Carolina | NC | Chemicals & Medicines |
$28.3B |
| North Dakota | ND | Industrial Machinery |
$1.1B |
| Ohio | OH | Chemicals & Medicines |
$13.9B |
| Oklahoma | OK | Energy | $7.1B |
| Oregon | OR | Computers & Electronics |
$9.2B |
| Pennsylvania | PA | Chemicals & Medicines |
$40.9B |
| Rhode Island | RI | Chemicals & Medicines |
$4.9B |
| South Carolina | SC | Chemicals & Medicines |
$9.6B |
| South Dakota | SD | Industrial Machinery |
$356M |
| Tennessee | TN | Chemicals & Medicines |
$33.5B |
| Texas | TX | Computers & Electronics |
$96.5B |
| Utah | UT | Raw Metals | $5.6B |
| Vermont | VT | Processed Food & Beverages |
$686M |
| Virginia | VA | Cars & Auto Parts |
$5.8B |
| Washington | WA | Cars & Auto Parts |
$11.8B |
| West Virginia | WV | Cars & Auto Parts |
$1.5B |
| Wisconsin | WI | Industrial Machinery |
$7.3B |
| Wyoming | WY | Processed Food & Beverages |
$213M |
In second place, computers and electronics are the top import in another 9 states.
This category includes computers, TVs, smartphones, as well as chips for electronics. California leads the rest of the country by the import value ($153 billion) in this category.
Together, these two groups—targets of on-again, off-again tariffs—are the top import in about half of all states.
Trade War Tussles
At the time of publishing this article, the Trump Administration has implemented a general 10% tariff on imports from a long list of countries coming into America.
There are a few exceptions: some have no tariffs (pharmaceuticals), and some have higher tariffs (cars, steel, and aluminum, all at 25%).
A tariff on auto parts, expected in May, will disrupt auto supply chains further.
Finally, China has also attracted the highest tariff charge, now stacked to 125% on all imported goods from the country.
However, electronics have been exempted from this rate, though there is no indication of how long these exemptions will last.
Learn More on the Voronoi App ![]()
Looking at this map alongside The Top Import Partners by State gives you a quick overview of America’s trade patterns.