Published
14 seconds ago
on
June 29, 2023
| 181 views
-->
By
Jenna Ross
Graphics & Design
- Athul Alexander
The following content is sponsored by New York Life Investments
How much do you know about investing during a recession?
This knowledge is becoming more valuable as the likelihood of a U.S. recession grows. The New York Federal Reserve estimates the probability of a recession occurring within the next 12 months at 71%, up from 6% in May 2022.
Amid this economic uncertainty, this quiz from New York Life Investments can help you test your knowledge.
The first image presents a statement and you can guess whether it is “fact” or “fiction”.
#1: Timing of Stock Market Bottoms
When do you think the market low occurs during recessions? Is it before an official announcement is made?
![]()
Swipe right to see the answer and explore data from past recessions.
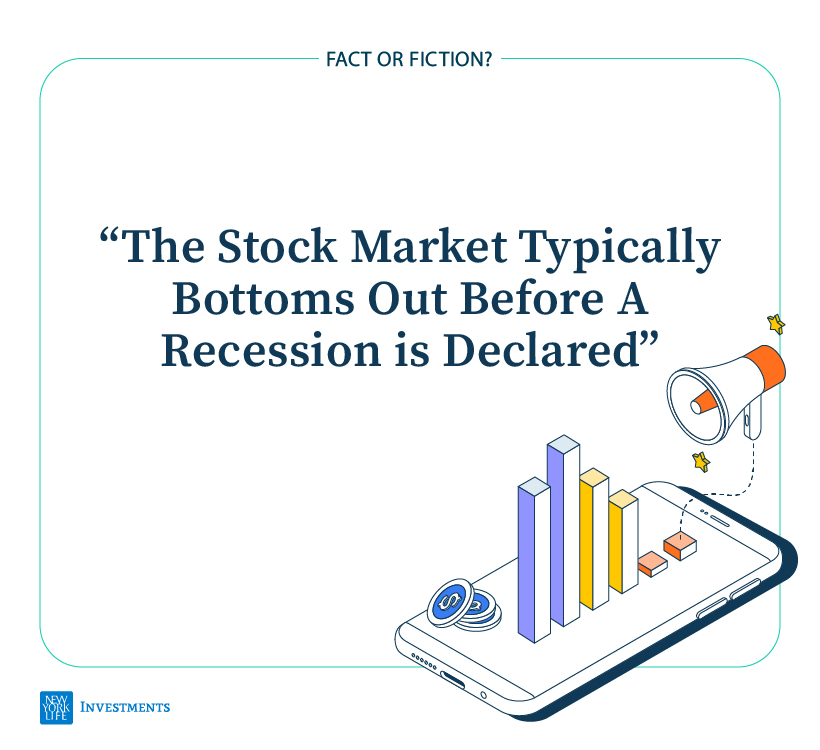
The S&P 500 market low occurred before the National Bureau of Economic Research (NBER) announced a recession in four of the last six recessions. The exceptions were Reagan’s Recession in 1981-1982 and the Global Financial Crisis in 2007-09, which both lasted more than a year.
Since the NBER waits to make an announcement until they are certain a trough in economic activity has occurred, their declarations have historically happened 4-21 months after a recession has started.
Investors should avoid fear-based portfolio decisions when a recession announcement is made because, in the past, the worst market losses have typically already occurred.
#2: Investing During A Recession
Is it a bad time to invest when economic activity is declining?
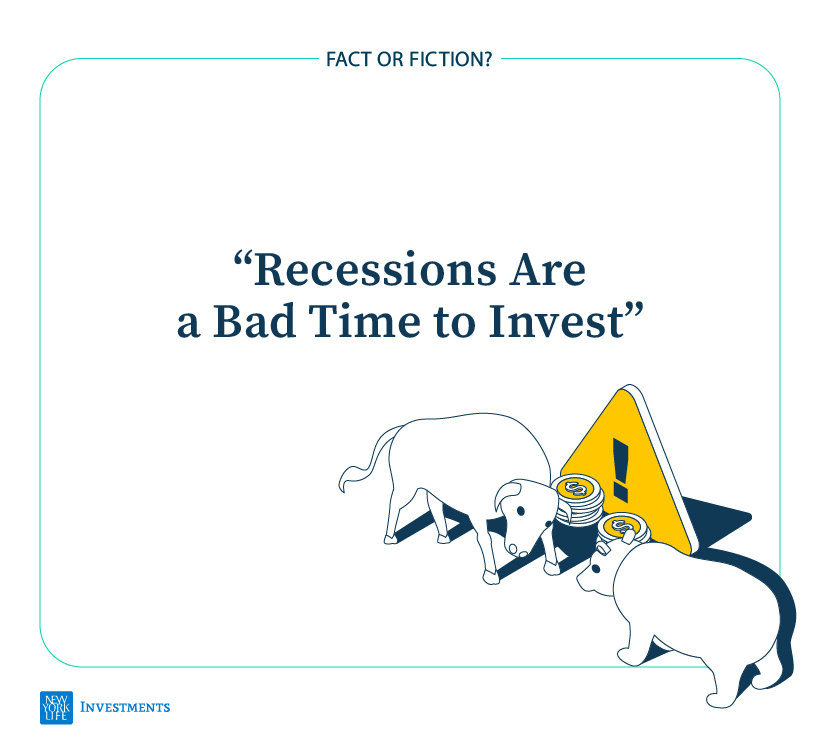
Stock markets are a leading indicator, meaning they point towards the future direction of the economy. Historically, they have begun to recover before a recession was declared over.
In fact, S&P 500 gains averaged 40% from market lows until the date the NBER announced the end of a recession. People who avoided investing during a recession and waited until it had clearly ended would have missed out on market gains.
Not only that, stocks may be attractively priced given that price-to-earnings ratios have dipped near the beginning of most recessions since 1980. For instance, the S&P 500 P/E ratio dropped from 27.73 in January 2020 to 22.22 in March 2020.
#3: Sector Performance During Recessions
Does the performance of sectors like energy or real estate vary over the course of a recession?
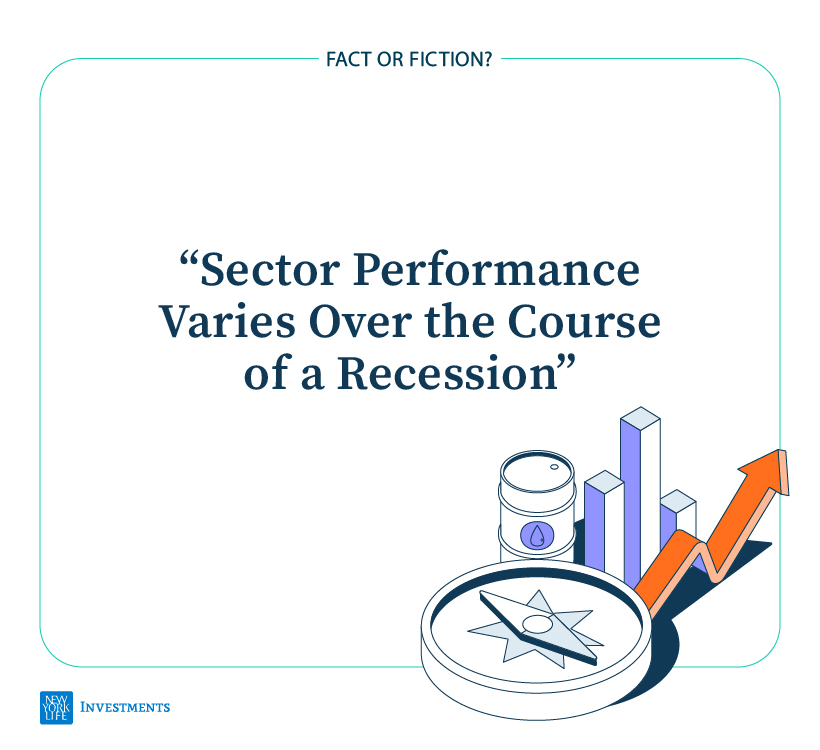
The health care sector performed the best overall during the last 3 recessions, as shown by the black dots. We measured this by comparing the monthly return difference between each sector and the S&P 500 overall.
However, certain sectors have outperformed either at the start or end of recessions. Financials and real estate were some of the worst-performing sectors, but saw strong rebounds near the end of economic downturns. For instance, real estate had monthly returns nearly 6% higher than the S&P 500 during the last 3 months of recessions.
Given that the exact timing of a recession is hard to determine in real time, investors may want to consider diversifying their sector exposure.
Making Informed Decisions
While economic downturns can make investors fearful, history has given us insights into investing during a recession.
- Avoid panic selling: The worst market losses have typically already occurred by the time a recession is officially announced.
- Explore market opportunities: If an investor waited to invest until there were clear signs a recession was over, they would have missed out on market gains.
- Diversify sector exposure: Sectors like energy outperformed at the start of recessions, while sectors like real estate rebounded at the end.
By considering these tips, investors may be better positioned to remain resilient.

The Conference Board Leading Economic Index is an American economic leading indicator intended to forecast future economic activity. The New York Federal Reserve Probability of U.S. Recession is based on the difference between the 10-year and 3-month Treasury rates. The S&P 500 Index is an unmanaged index that is widely regarded as the standard for measuring large-cap U.S. stock market performance. The National Bureau of Economic Research (NBER) traditionally defines a recession as a significant decline in economic activity that is spread across the economy and that lasts more than a few months. The S&P 500 Communication Services Index comprises those companies included in the S&P 500 that are classified as members of the GICS communication services sector. The S&P 500 Consumer Discretionary Index comprises those companies included in the S&P 500 that are classified as members of the GICS consumer discretionary sector. The S&P 500 Consumer Staples Index comprises those companies included in the S&P 500 that are classified as members of the GICS consumer staples sector. The S&P 500 Energy Index comprises those companies included in the S&P 500 that are classified as members of the GICS energy sector. The S&P 500 Financials Index comprises those companies included in the S&P 500 that are classified as members of the GICS financials sector. The S&P 500 Health Care Index comprises those companies included in the S&P 500 that are classified as members of the GICS health care sector. The S&P 500 Industrials Index comprises those companies included in the S&P 500 that are classified as members of the GICS industrials sector. The S&P 500 Information Technology Index comprises those companies included in the S&P 500 that are classified as members of the GICS information technology sector. The S&P 500 Materials Index comprises those companies included in the S&P 500 that are classified as members of the GICS materials sector. The S&P 500 Real Estate Index comprises those companies included in the S&P 500 that are classified as members of the GICS Real Estate sector. The S&P 500 Utilities Index comprises those companies included in the S&P 500 that are classified as members of the GICS Utilities sector. It is not possible to invest directly in an index. Past performance is not indicative of future results. Different time periods may have different results. This material represents an assessment of the market environment as of a specific date; is subject to change; and is not intended to be a forecast of future events or a guarantee of future results. This information should not be relied upon by the reader as research or investment advice. This material contains general information only and does not take into account an individual’s financial circumstances. This information should not be relied upon as a primary basis for an investment decision. Rather, an assessment should be made as to whether the information is appropriate in individual circumstances and consideration should be given to talking to a financial professional before making an investment decision. “New York Life Investments” is both a service mark, and the common trade name, of certain investment advisors affiliated with New York Life Insurance Company. 5758918 MS40yy-06/23

Please enable JavaScript in your browser to complete this form.Subscribe to our free newsletter and get your mind blown on a daily basis: *Sign up
Related Topics: #New York Life Investments #NYLI #Recession #s&p 500 #sectors #stocks
Click for Comments
var disqus_shortname = "visualcapitalist.disqus.com";
var disqus_title = "Fact or Fiction? Test Your Knowledge About Investing During a Recession";
var disqus_url = "https://www.visualcapitalist.com/sp/fact-or-fiction-test-your-knowledge-about-investing-during-a-recession/";
var disqus_identifier = "visualcapitalist.disqus.com-158817";
You may also like
-

Markets19 hours ago
Chart: U.S. Home Price Growth Over 50 Years
Home price growth has moderated amid rising interest rates and a narrow housing supply. Here’s how prices compare to historical trends.
-

Markets2 days ago
What are Top Investment Managers Holding in Their Portfolios?
In this excerpt from our Markets This Month VC+ newsletter, we looked at how five portfolios of super investors shaped up at end of Q1 2023.
-

Finance3 days ago
Visualized: The 100 Largest U.S. Banks by Consolidated Assets
In this visual we showcase the relative size of the 100 largest U.S. banks in terms of consolidated assets.
-

Markets1 week ago
Visualizing Every Company on the S&P 500 Index
S&P 500 companies make up $34 trillion in market value combined. This graphic shows how they break down by weight and sector.
-

Markets1 week ago
Visualizing BlackRock’s Top Equity Holdings
BlackRock is the world’s largest asset manager, with over $9 trillion in holdings. Here are the company’s top equity holdings.
-

Markets1 week ago
The World’s Biggest Mutual Fund and ETF Providers
In 2022, the global net assets of mutual fund and ETF providers totaled $38 trillion. This chart shows the industry’s biggest brands.
Subscribe
Please enable JavaScript in your browser to complete this form.Join the 380,000+ subscribers who receive our daily email *Sign Up
The post Fact or Fiction? Test Your Knowledge About Investing During a Recession appeared first on Visual Capitalist.