![]()
See this visualization first on the Voronoi app.
Use This Visualization
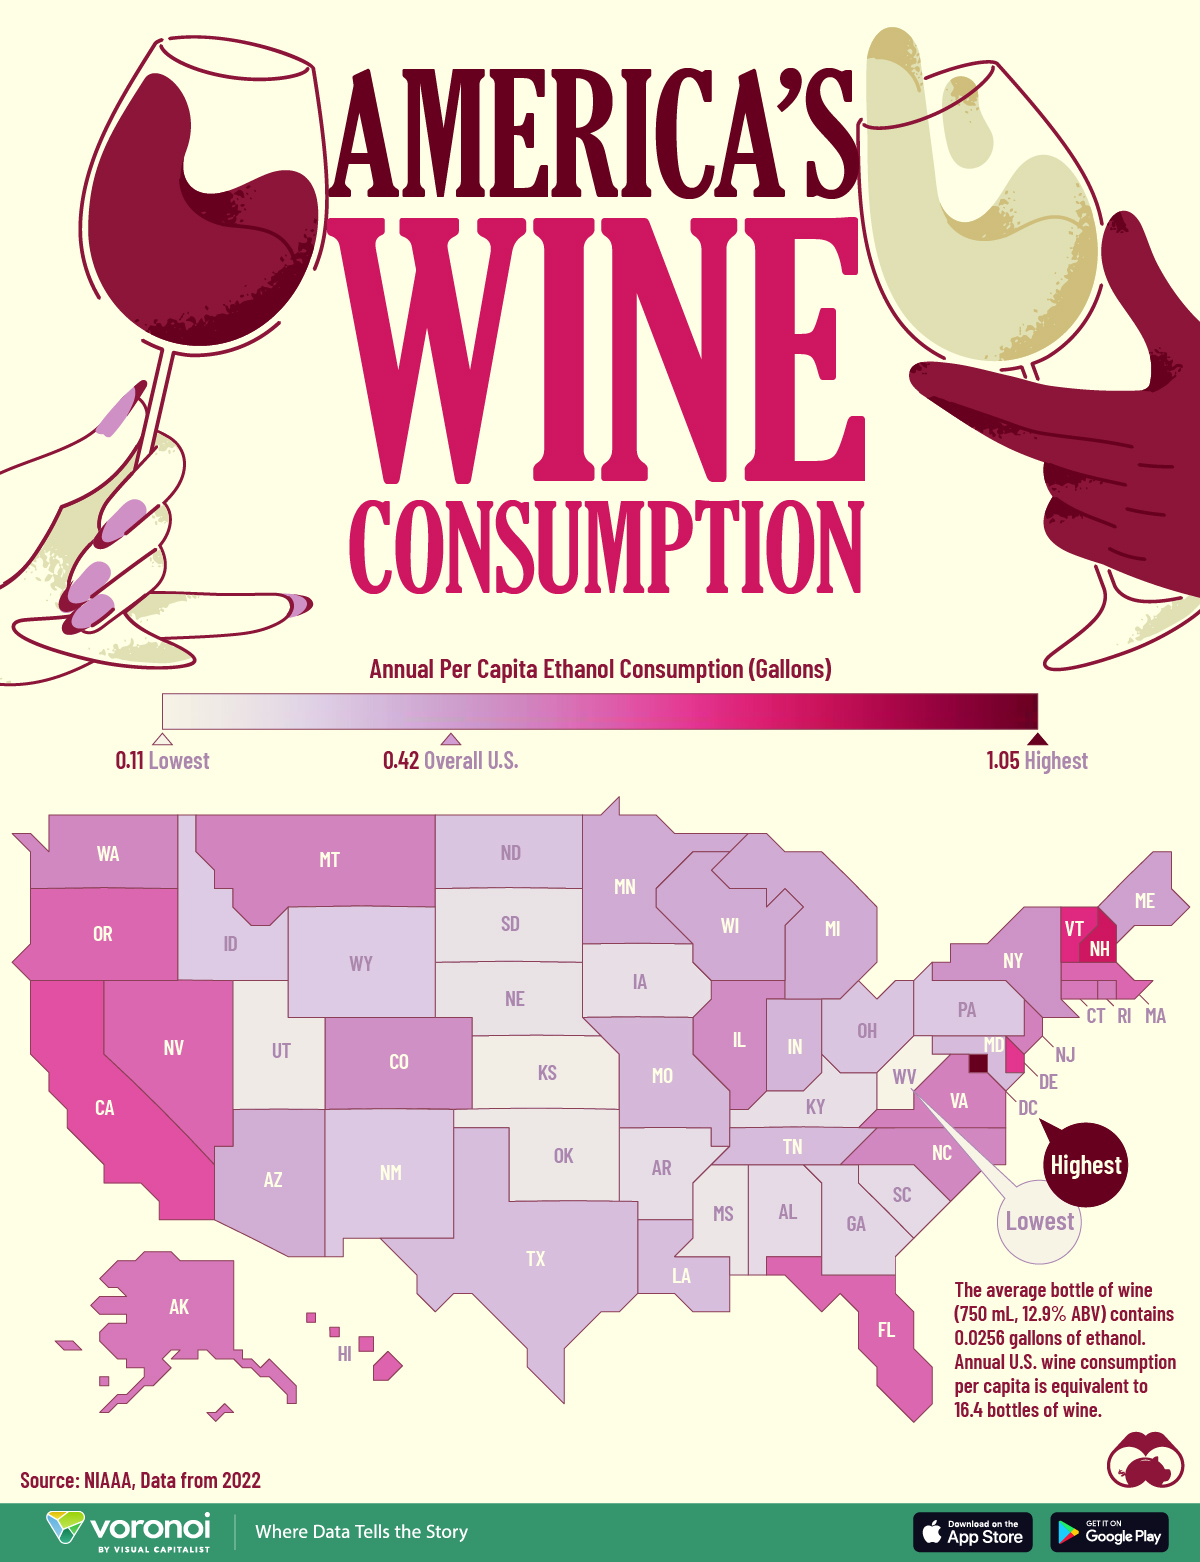
Wine Consumption Per Capita by U.S. State
This was originally posted on our Voronoi app. Download the app for free on iOS or Android and discover incredible data-driven charts from a variety of trusted sources.
From coast to coast, wine is often seen as a staple on tables across the U.S, with certain regions raising their glasses a little more often.
From California’s Napa Valley to New York’s Finger Lakes, the U.S. is home to several world-renowned wine regions, and ranked third in Forbes’ list of top 10 countries for wine lovers.
This map visualizes the annual per capita ethanol consumption of wine in gallons in 2022, by state. The data comes from the National Institute on Alcohol Abuse and Alcoholism (NIAAA), which measures alcohol consumption in ethanol volume.
For reference, the average bottle of wine (750 mL, 12.9% ABV) contains 0.0256 gallons of ethanol.
Consumption figures only include residents age 14 or older, and is based on alcoholic beverage sales data collected by the Alcohol Epidemiologic Data System (AEDS), the National Alcohol Beverage Control Association, and from various reports produced by beverage industry sources.
Which States Consume the Most Wine?
Below, we show the per capita ethanol consumption in gallons of wine for each state.
| State | Per capita ethanol consumption in gallons of wine |
|---|---|
| District of Columbia | 1.05 |
| New Hampshire | 0.8 |
| Vermont | 0.72 |
| Delaware | 0.68 |
| California | 0.62 |
| Hawaii | 0.58 |
| Florida | 0.57 |
| Massachusetts | 0.57 |
| Nevada | 0.57 |
| Oregon | 0.57 |
| Alaska | 0.53 |
| Connecticut | 0.53 |
| Rhode Island | 0.52 |
| New Jersey | 0.51 |
| Virginia | 0.51 |
| Montana | 0.5 |
| North Carolina | 0.49 |
| Washington | 0.49 |
| Illinois | 0.48 |
| Colorado | 0.47 |
| New York | 0.46 |
| Maine | 0.42 |
| Michigan | 0.39 |
| Minnesota | 0.39 |
| Wisconsin | 0.39 |
| Arizona | 0.38 |
| Indiana | 0.36 |
| Missouri | 0.35 |
| Maryland | 0.34 |
| Tennessee | 0.34 |
| Louisiana | 0.33 |
| Texas | 0.33 |
| North Dakota | 0.31 |
| Ohio | 0.31 |
| New Mexico | 0.3 |
| Pennsylvania | 0.3 |
| Idaho | 0.29 |
| Wyoming | 0.29 |
| Georgia | 0.25 |
| Alabama | 0.24 |
| South Carolina | 0.24 |
| Arkansas | 0.23 |
| Iowa | 0.22 |
| Kentucky | 0.22 |
| Nebraska | 0.21 |
| South Dakota | 0.21 |
| Mississippi | 0.19 |
| Oklahoma | 0.18 |
| Utah | 0.17 |
| Kansas | 0.15 |
| West Virginia | 0.11 |
The average annual per capita ethanol consumption from wine in the U.S. is 0.42 gallons, which is equivalent to about 16.4 bottles of wine.
Overall wine consumption in the U.S. has been on the decline in the past few years, according to reports by Silicon Valley Bank.
Wine sales and tasting room visitations both dropped for the second straight year, and as of 2024, an oversupply of planted vineyards may lead to discounting and price reduction.
In 2022, D.C. residents had the highest per capita wine consumption in the U.S., with an annual average of 1.05 gallons of ethanol from wine, or 41 bottles of wine.
New Hampshire’s lack of state sales tax makes alcohol, including wine, significantly cheaper than in neighboring states, which likely drives higher wine purchases and consumption as residents from nearby areas cross state lines to take advantage of the lower prices.
Learn More on the Voronoi App
To learn more about alcohol consumption in the U.S., check out this graphic that shows beer consumption by U.S. state.
The post Mapped: America’s Wine Consumption By State appeared first on Visual Capitalist.