![]()
See this visualization first on the Voronoi app.
Use This Visualization
America’s Energy Shift: From Coal to What? (1950–2024)
This was originally posted on our Voronoi app. Download the app for free on iOS or Android and discover incredible data-driven charts from a variety of trusted sources.
Key Takeaways
- Over the last seven decades, power generation in the U.S. has shifted from coal dominance to natural gas.
- Crude oil remains the second most important source of power, despite widespread efforts to reduce fossil fuel consumption.
- Renewables have grown steadily but still represent less than 9% of the total energy mix.
This animated chart uses data from the U.S. Energy Information Administration to illustrate how the country’s energy generation landscape has evolved since 1950.
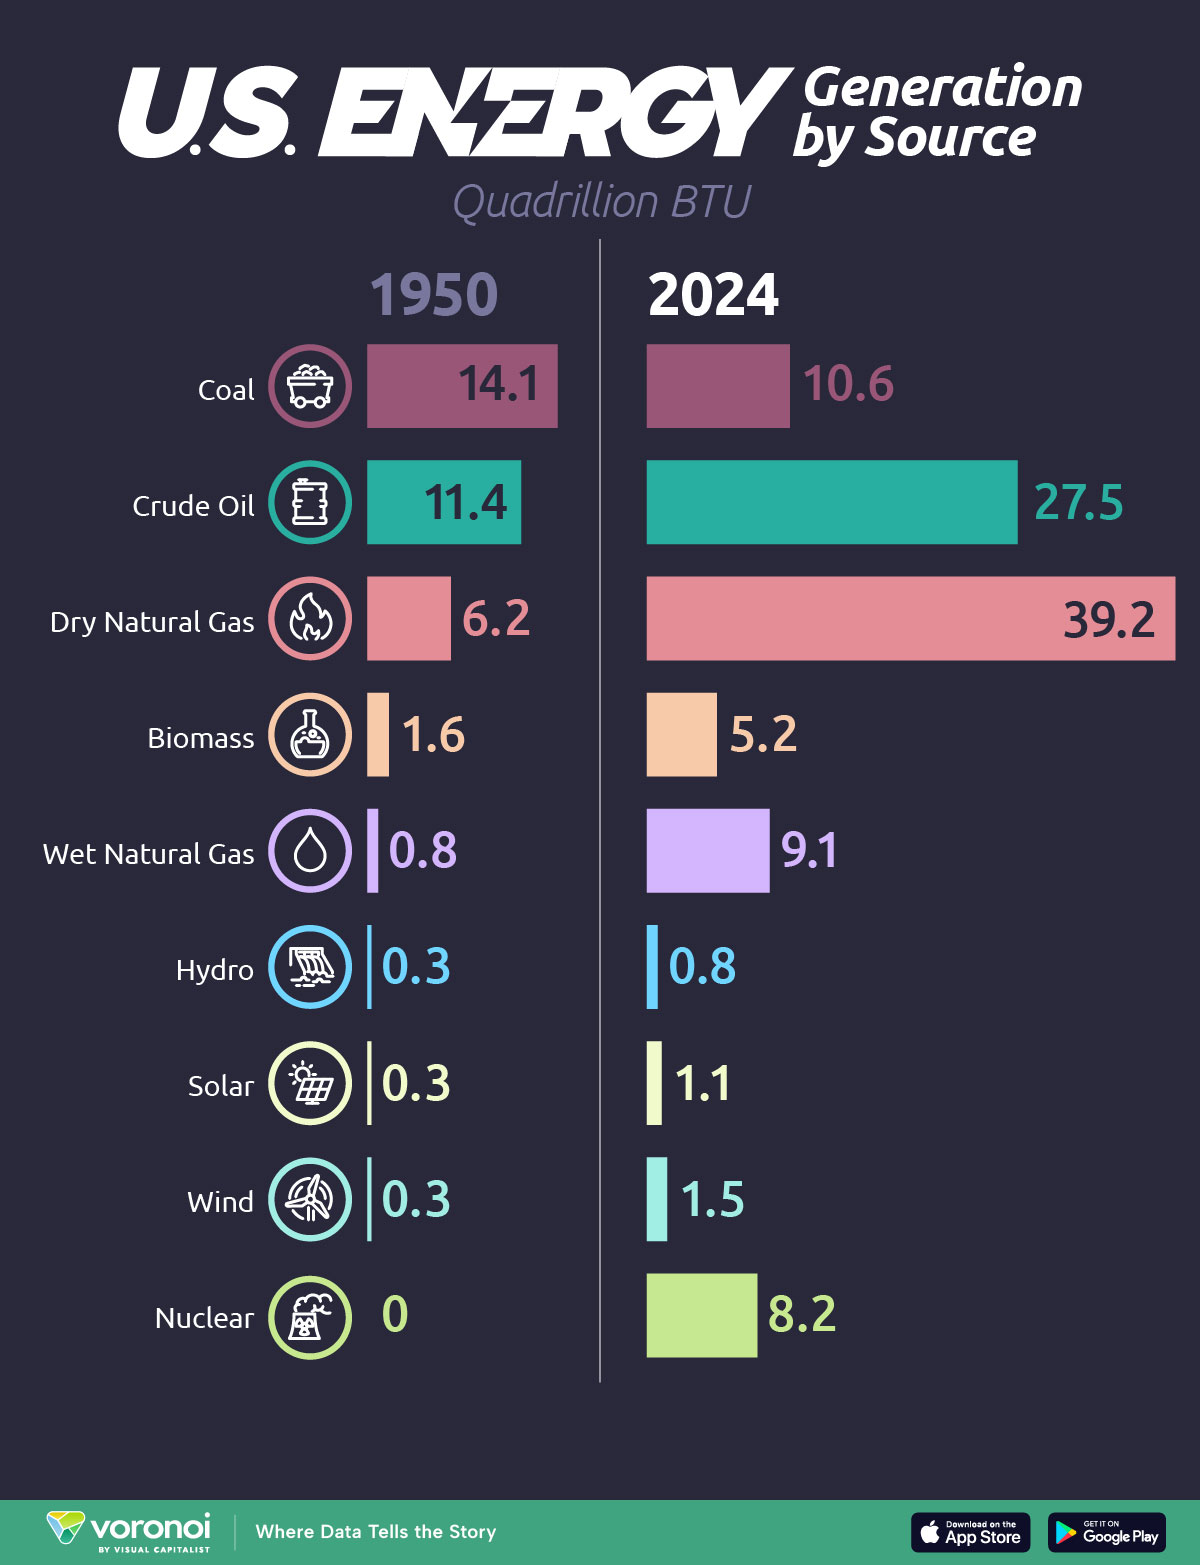
U.S. Energy Generation by Source, 1950–2024
As seen in the video above, natural gas has experienced the most significant growth—rising from just 6.2 quadrillion BTUs in 1950 to 39.2 in 2024—making it the leading energy source in recent years, surpassing both coal and oil.
Coal use peaked between 2000 and 2005 but has since declined sharply, falling from 23.2 quadrillion BTUs in 2005 to just 10.6 in 2024. Meanwhile, crude oil usage resurged in the early 2010s after years of contraction, peaking in 2024 at 27.5 quadrillion BTUs.
| Year (Quadrillion Btu) | 1950 | 1970 | 1990 | 2010 | 2020 | 2024 |
|---|---|---|---|---|---|---|
| Coal | 14.1 | 14.6 | 22.5 | 22.0 | 10.7 | 10.6 |
| Natural Gas (Dry) | 6.2 | 21.7 | 18.3 | 21.8 | 35.1 | 39.2 |
| Crude Oil | 11.4 | 20.4 | 15.6 | 11.6 | 23.6 | 27.5 |
| Natural Gas (Wet) | 0.8 | 2.5 | 2.1 | 2.7 | 6.8 | 9.1 |
| Nuclear | 0.0 | 0.2 | 6.1 | 8.4 | 8.3 | 8.2 |
| Hydro | 0.3 | 0.9 | 1.0 | 0.9 | 1.0 | 0.8 |
| Solar | 0.3 | 0.3 | 0.0 | 0.1 | 0.5 | 1.1 |
| Wind | 0.3 | 0.3 | 0.0 | 0.3 | 1.2 | 1.5 |
| Biomass | 1.6 | 1.4 | 2.7 | 4.6 | 4.7 | 5.2 |
Renewables such as wind and solar, though still relatively small in absolute terms, have shown consistent growth since 2005. Wind reached 1.5 quadrillion BTUs by 2024, while solar grew from virtually zero to 1.1 quadrillion BTU.
Nuclear energy has remained relatively stable since the 1990s, plateauing at around 8 quadrillion BTUs annually. This follows a period of rapid growth from the 1970s to the 1990s but has since been constrained by high costs and regulatory hurdles.
Learn More on the Voronoi App ![]()
If you enjoyed this topic, check out this graphic that shows how the world’s top economies generated electricity in 2024. Fossil fuels supplied nearly 60% of the global power generation last year, with coal alone contributing 35% of the total.